
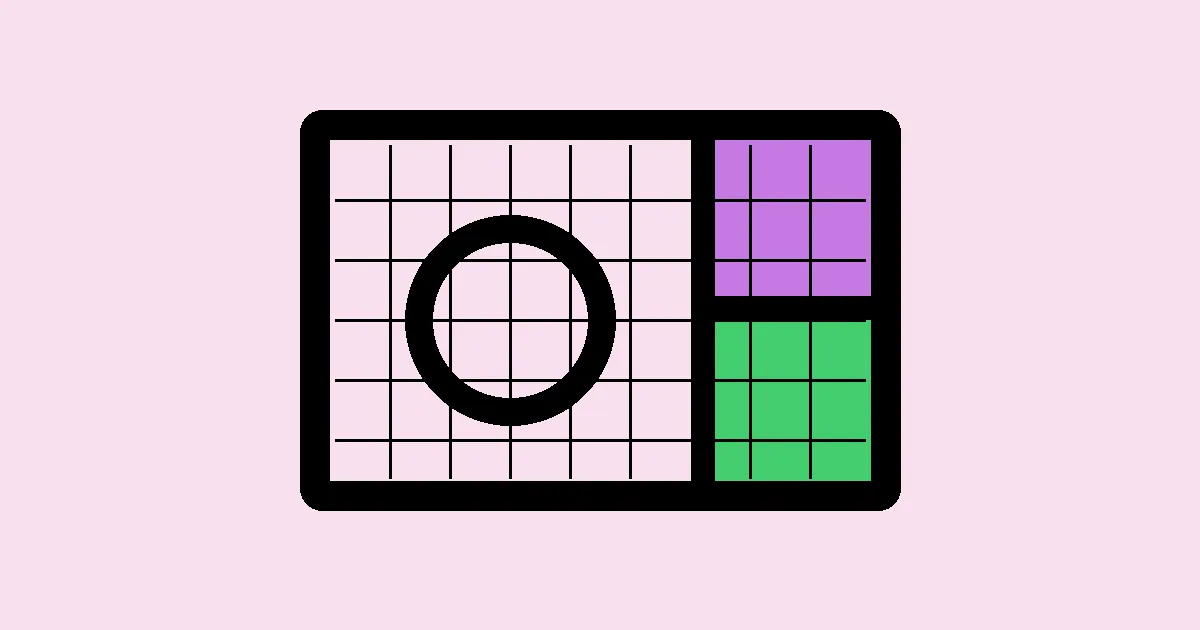
Proportion in Graphic Design: Practical Visual Balance
Proportion in graphic design is the planned relationship between sizes, spaces, weights, and visual importance inside a layout. The practical value of proportion in graphic design and visual balance is that it turns visual choices into decisions a client, team, or audience can understand and use.
Quick Answer: Proportion in Graphic Design: Practical Visual Balance is best understood as a practical design decision system: define the goal, shape hierarchy, test the smallest real use case, revise with evidence, and document rules so the result stays useful after the first deliverable.
What does proportion control in a real design layout?
Proportion controls how quickly a viewer understands importance. A headline that is only slightly larger than body copy creates hesitation. A product image that is enormous without enough breathing room feels loud instead of premium. Good proportion gives every part of a layout a job: lead, support, clarify, or rest.
Designers often learn proportion through ratios, but daily work is more practical than memorizing formulas. You are judging whether the relationship between objects feels believable for the message, channel, and audience. A sales banner, editorial feature, onboarding screen, and investor deck may all use the same grid yet need different proportional emphasis. For related fundamentals, compare this topic with monogram construction before judging the final look.
A practitioner looks for repeatable decisions. If the work depends on a single attractive mockup, it will probably break when the format, audience, budget, or production method changes. Useful design survives ordinary pressure: small screens, quick reviews, imperfect printing, rushed handoffs, and future updates by someone who was not in the original meeting.
How should you evaluate proportion in graphic design and visual balance?
Evaluation starts with the job the design must do. The first review should separate strategy, structure, craft, and production so feedback does not collapse into personal taste.
- Define the primary action or idea before sizing anything; proportion should follow priority, not habit. Record the reason behind the decision so later revisions do not drift back into guesswork.
- Create a clear scale for type, spacing, icons, image blocks, and supporting labels. Record the reason behind the decision so later revisions do not drift back into guesswork.
- Use contrast deliberately: one element can dominate, a few can support, and the rest should quiet down. Record the reason behind the decision so later revisions do not drift back into guesswork.
- Check the design at final output size because proportion changes when a layout shrinks or expands. Record the reason behind the decision so later revisions do not drift back into guesswork.
- Compare optical balance, not just mathematical equality; a dark block can feel heavier than a pale block of the same size. Record the reason behind the decision so later revisions do not drift back into guesswork.
- Leave negative space in proportion to importance so key elements feel chosen rather than stranded. Record the reason behind the decision so later revisions do not drift back into guesswork.
After the first pass, review the work in context. A design can look polished on a presentation slide and still fail when it is placed beside competitor material, loaded on a phone, printed at a small size, or handed to a non-designer who has to maintain it.
Proportion decisions and their design impact
A clear comparison table prevents design critique from becoming a debate about taste. Use it to connect each option to an operational consequence.
| Decision | Best use | Risk to manage |
|---|---|---|
| Type scale | Establishes reading order | Too many sizes fragment the message |
| Image-to-copy ratio | Controls emotional pull | Oversized images can bury the offer |
| Spacing rhythm | Creates confidence and calm | Uneven gaps make layouts look accidental |
| Component weight | Balances controls and content | Heavy controls can overpower the message |
The table is not a substitute for judgment. It is a way to make judgment visible, especially when several people have approval power and each person is reacting from a different priority.
What does practitioner analysis reveal?
Practitioner analysis reveals where the work will succeed under real constraints. In production work, proportion problems usually appear as symptoms: the layout feels cheap, busy, cold, or weak. The fix is rarely a single larger headline. I look for the dominant relationship causing the feeling, then adjust only that relationship. If the image is too dominant, reduce it or add copy weight. If the page feels empty, increase the connection between related elements before filling the gap with decoration.
This is also where a designer should look sideways at adjacent skills. A strong outcome often depends on the same discipline found in UX visual hierarchy: hierarchy, clear language, predictable systems, and restraint under pressure.
I avoid unsupported numerical claims unless a current, named source is being cited directly. In many design decisions, the most reliable evidence is observed behavior: where viewers pause, what clients misunderstand, which assets break in production, and which rules other team members can apply without further explanation.
Common mistakes and how do you avoid them?
Most weak outcomes come from starting too visually and testing too late. Avoid these mistakes by connecting every craft decision to a purpose the viewer or business can recognize.
- Treating proportion as a fixed ratio instead of a decision tied to message hierarchy. The safer fix is to name the underlying risk, adjust the system, and test the result in the smallest demanding format.
- Making every element medium-sized, which leaves the viewer with no obvious starting point. The safer fix is to name the underlying risk, adjust the system, and test the result in the smallest demanding format.
- Relying on center alignment to solve imbalance that actually comes from unequal visual weight. The safer fix is to name the underlying risk, adjust the system, and test the result in the smallest demanding format.
- Using spacing values randomly across similar components. The safer fix is to name the underlying risk, adjust the system, and test the result in the smallest demanding format.
- Reviewing only on a large monitor when the design will mostly be seen on phones. The safer fix is to name the underlying risk, adjust the system, and test the result in the smallest demanding format.
Another mistake is presenting unfinished reasoning. Stakeholders do not need a lecture, but they do need enough logic to approve confidently. Show the problem, the constraint, the alternatives rejected, and the reason the chosen direction is the strongest option.
How do you implement proportion in graphic design and visual balance step by step?
Implementation works best when it moves from purpose to proof. The following workflow is the one I use when a design has to leave the studio and perform in real use.
- Write the design problem in one sentence and remove any wording that describes style before purpose. Apply that step directly to proportion in graphic design and visual balance rather than treating it as a generic design checklist.
- List the real placements, users, file formats, approval stages, and maintenance needs before choosing the visual direction. Apply that step directly to proportion in graphic design and visual balance rather than treating it as a generic design checklist.
- Create rough alternatives that differ in structure, not only color or surface treatment. Apply that step directly to proportion in graphic design and visual balance rather than treating it as a generic design checklist.
- Select the strongest route by testing clarity, scalability, accessibility, and production practicality. Apply that step directly to proportion in graphic design and visual balance rather than treating it as a generic design checklist.
- Refine the chosen route with consistent spacing, type hierarchy, alignment, and export rules. Apply that step directly to proportion in graphic design and visual balance rather than treating it as a generic design checklist.
- Document the final system so another person can reproduce the decision without guessing. Apply that step directly to proportion in graphic design and visual balance rather than treating it as a generic design checklist.
For a campaign graphic, I start by printing or previewing the layout at the size where most people will encounter it. I squint to see the massing, then mark the first three things my eye notices. If those three are not the intended priority, I adjust scale, spacing, or contrast until the sequence matches the brief. Only after that do I refine corners, icons, and small typographic details.
Before delivery, I run one final stress test: remove the explanation and ask whether the work still communicates. If the answer depends on a long verbal defense, the design needs clearer hierarchy, simpler rules, or a stronger connection between form and purpose.
A second delivery check is maintenance. Ask who will use the files next month, what they will change, and which mistake would damage the work fastest. For proportion in graphic design and visual balance, that usually means naming the minimum spacing, acceptable variations, export settings, and review standards. This practical documentation protects the design from slow erosion after approval.
The final check is audience behavior. Look at the design from the viewer’s actual position, not the creator’s desk. Consider distance, time pressure, competing messages, device quality, and the viewer’s likely question. If the design answers that question quickly and still feels distinctive, the system is ready to ship. If it does not, revise the relationship between message, hierarchy, and format before adding more visual material. Keep the revision narrow, because focused changes preserve what already works while exposing the exact decision that still needs improvement. That discipline also keeps review conversations shorter, calmer, clearer, and more useful for clients, designers, instructors, and production partners.
When the project reaches approval, package the rationale with the files. Include the primary objective, the audience context, the strongest constraints, the rejected alternatives, and the rules that protect the final direction. This does not need to be long, but it should be specific enough that a future designer, marketer, founder, or developer can make a small update without undoing the original thinking. That handoff is where professional design becomes operational instead of decorative.
Key Takeaways
- Proportion in Graphic Design: Practical Visual Balance works best when purpose, hierarchy, and production constraints are decided before surface style.
- Strong design systems are built from repeatable decisions, not from one attractive presentation mockup.
- Practical critique should name the business or user risk behind every requested change.
- Small-format testing reveals weaknesses that large, polished previews often hide.
- Documentation turns a good design into a usable asset that teams can maintain confidently.
Frequently Asked Questions
What is the simplest way to start with proportion in graphic design and visual balance?
Start by writing the goal in plain language and naming the audience, format, and decision the viewer should make. Then create two or three structurally different options. Do not begin with decoration; begin with hierarchy, constraints, and the smallest use case that must still work.
How do beginners practice proportion in graphic design and visual balance effectively?
Beginners improve fastest when they rebuild real examples, explain each design decision, and revise after critique. Practice should include typography, spacing, contrast, export quality, and presentation. A small finished case study with clear reasoning teaches more than many unconnected experiments.
What makes professional work different from student work?
Professional work accounts for messy constraints: deadlines, stakeholder preferences, production limits, accessibility, future updates, and brand consistency. Student work often focuses on the final image. Professional work shows the thinking that keeps the design useful after handoff.
How much software skill is needed for proportion in graphic design and visual balance?
Software fluency matters because slow execution limits exploration, but software is not the core skill. The core skill is deciding what should be emphasized, simplified, aligned, removed, or documented. Tools help you execute those decisions with speed and accuracy.
How do you know when the design is finished?
A design is finished when it solves the defined problem, works in the required formats, survives small-size testing, and can be explained without vague taste language. If the team still needs exceptions for common uses, the system needs another refinement pass.
Can proportion in graphic design and visual balance improve business results?
It can support business results when it reduces confusion, strengthens recognition, improves trust, or helps people act faster. Design cannot fix a weak offer by itself, but it can make a sound offer easier to understand, remember, and choose.
Conclusion
The most important decision is to treat proportion in graphic design and visual balance as a working system rather than a finished picture. Define the purpose, test the demanding use cases, and keep only the visual choices that improve understanding. As a next step, study retro design systems and compare how its principles can strengthen your next project.