
The Analytics Process Explained: A 7-Step Framework for Turning Raw Data Into Decisions
Analytics fails more often from process gaps than from missing tools. The analytics process is the structured, repeatable sequence organisations follow to convert raw data into a decision: define the question, collect and validate data, prepare it, analyse it, interpret the results, act, and measure the outcome. Skipping or reordering these stages is why dashboards proliferate while decisions stay unchanged. In practice, the most expensive mistake is beginning with available data instead of a defined question — that path produces charts that describe the data warehouse rather than the business. A disciplined analytics process is also what makes results defensible: when a stakeholder challenges a number, you can trace exactly which source, transformation, and assumption produced it.
Quick Answer: The analytics process is a repeatable seven-stage cycle: define the business question, collect data, clean and validate it, analyse it, interpret findings in business terms, act on the decision, and measure the outcome. Each stage has a specific deliverable, and the cycle repeats so insights improve with every iteration rather than ending at a dashboard.
Building a Repeatable Analytics Workflow With Support From WebPeak
Most teams do not need a bigger tool stack — they need the analytics process wired into the systems they already run, from web tracking to CRM reporting. That integration work is where the agency team at WebPeak tends to add the most leverage, connecting measurement setup, reporting layers, and campaign data into one auditable flow. Their digital marketing services engagements typically begin with defining the decisions a client actually makes each month, then working backwards to the tracking and reporting required to support them. They also run competitor website analysis work that gives the interpretation stage external context, so internal trends are judged against the market rather than in isolation.
What Are the Stages of the Analytics Process, and What Does Each Produce?
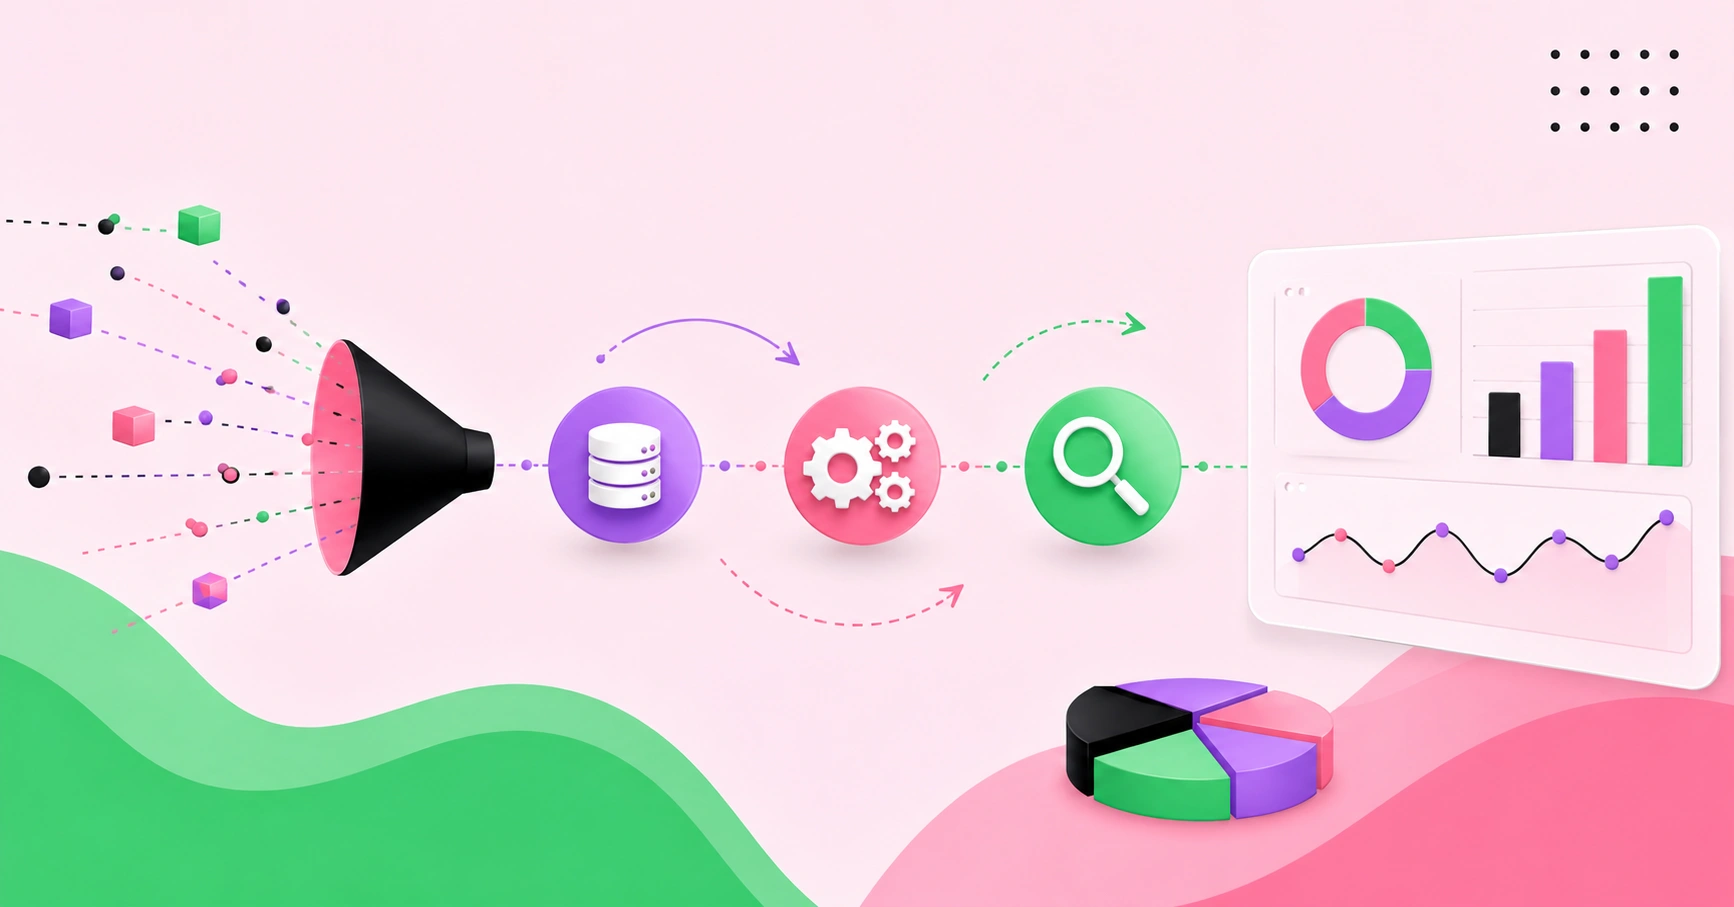
Every stage of the analytics process has a concrete deliverable, and treating them as deliverables rather than activities is what keeps projects honest. Stage one, problem definition, produces a written decision statement naming the decision, the owner, and the deadline. Stage two, data collection, produces a documented inventory of sources with their refresh cadence and known limitations. Stage three, data preparation — the cleaning, joining, deduplication, and type-casting work that consumes the largest share of analyst time on most projects — produces a reproducible transformation script, not a manually edited spreadsheet. Stage four, analysis, produces quantified findings with confidence caveats attached. Stage five, interpretation, translates statistics into commercial language: not "conversion correlates with session depth" but "visitors who view three or more product pages convert at a materially higher rate, so the product listing page deserves priority." Stage six, action, produces a change actually shipped. Stage seven, measurement, produces evidence of whether the change worked. The established CRISP-DM methodology, published in 1999 and still widely taught, formalised a similar cycle across six phases and explicitly made it iterative — a reminder that this is a loop, not a pipeline with an end.
How Do You Run the Analytics Process Correctly? A Step-by-Step Checklist
Use this checklist for any analytics request, whether it takes two hours or two quarters:
- Write the decision statement. One sentence naming the decision, the owner, and when it must be made. Refuse requests that cannot be written this way.
- Agree the metric definition in writing. Define "active user" or "qualified lead" before pulling data; ambiguity here invalidates every downstream number.
- Inventory and validate sources. Check row counts, date coverage, and duplicate keys before analysis. Reconcile totals against a trusted system of record.
- Make preparation reproducible. Keep transformations in versioned SQL or scripts so any result can be regenerated months later.
- Analyse with a stated hypothesis. Decide in advance what result would change the decision, which prevents retrofitting a narrative to whatever the data shows.
- Present findings as decisions, not charts. Lead with the recommendation, then supporting evidence, then caveats.
- Instrument the outcome before shipping. Define the success metric and observation window in advance so results cannot be reinterpreted after the fact.
The highest-yield discipline on that list is step two. In practice, most disputes about analytics results are not disagreements about the data — they are two teams using the same word for different definitions.
How Do the Four Types of Analytics Fit Into the Process?
The analysis stage is not one activity; it spans four escalating levels of sophistication, each answering a different question and requiring different inputs. Descriptive analytics summarises what happened. Diagnostic analytics explains why. Predictive analytics estimates what will happen. Prescriptive analytics recommends what to do about it. Organisations routinely attempt predictive work before their descriptive foundation is trustworthy, which produces forecasts built on inconsistent definitions. The sequence matters because each level depends on the reliability of the one below it. The table below maps the four levels to their typical question, method, and prerequisite.
| Analytics Level | Question It Answers | Prerequisite Before Starting |
|---|---|---|
| Descriptive | What happened last period? | Agreed metric definitions and reconciled data sources |
| Diagnostic | Why did it happen? | Segmentable dimensions and sufficient historical depth |
| Predictive | What is likely to happen next? | Clean labelled history and features available at prediction time |
| Prescriptive | What action should we take? | Reliable predictions plus known constraints and costs |
| Continuous measurement | Did our action work? | Control group or pre-defined success window |
What Actually Breaks the Analytics Process — and What the Evidence Suggests
The failure points are consistent and mostly organisational. Industry practitioner surveys and long-standing commentary from analytics leaders have repeatedly put data preparation and cleaning as the single largest consumer of analyst time — a widely cited figure in the field places it at roughly 60 to 80 percent of project effort, which is why investment in pipeline reliability usually returns more than investment in visualisation. Google's own documentation on measurement has long emphasised that unclear or duplicated event definitions are among the most common causes of untrustworthy web analytics, which aligns with what shows up in almost every audit: tracking implemented without a definition document.
An observation from practice that rarely appears in textbook treatments: the analytics process degrades fastest at the handover between interpretation and action. Analysts finish at the insight, operators expect an instruction, and the gap gets filled by nobody. The fix is procedural rather than technical — the analyst writes the recommended action and the operator signs off on it in the same document, so ownership transfers explicitly. A second practical pattern: teams that maintain a single written metrics dictionary resolve reporting disputes in minutes instead of days, because the argument moves from "your number is wrong" to "we are using different definitions." Where the analytics process needs to extend into campaign execution and channel measurement, aligning it with a broader digital marketing programme keeps reporting consistent across internal and agency teams.
Key Takeaways
- The analytics process is a seven-stage loop — define, collect, prepare, analyse, interpret, act, measure — and each stage should produce a written deliverable.
- Data preparation is widely cited as consuming roughly 60 to 80 percent of analytics project effort, making pipeline reliability a higher-return investment than dashboard design.
- CRISP-DM, published in 1999, formalised analytics as an iterative cycle rather than a linear pipeline, and that iterative framing still holds.
- Agree metric definitions in writing before pulling data; most analytics disputes stem from definition mismatches, not incorrect calculations.
- Predictive and prescriptive analytics only produce trustworthy output when the descriptive layer beneath them is reconciled and consistently defined.
Frequently Asked Questions
What is the analytics process in simple terms?
It is the repeatable sequence for turning raw data into a decision: define the question, gather data, clean it, analyse it, interpret the results in business language, take action, and measure whether the action worked. Each step has a deliverable, and the whole cycle repeats.
Which step of the analytics process takes the longest?
Data preparation — cleaning, joining, deduplicating, and validating sources. Practitioner consensus in the field places it at roughly 60 to 80 percent of total project effort. Investing in reproducible transformation scripts rather than manual spreadsheet fixes is the most effective way to reduce it.
How is the analytics process different from data science?
The analytics process is the workflow; data science is one set of methods used inside its analysis stage. You can complete the full analytics process using SQL and clear reasoning alone. Data science becomes relevant when the question requires prediction or pattern discovery at scale.
Do small businesses need a formal analytics process?
Yes, though a lighter version. Even a one-page decision statement, a written metrics dictionary, and a defined review cadence prevent the most costly errors. Smaller teams benefit disproportionately because they have less capacity to absorb decisions made on misdefined numbers.
How do I know if my analytics process is actually working?
Check whether decisions changed. If your last five analyses produced no shipped change, the process is stalling at the interpretation-to-action handover. A healthy process leaves a visible trail of decisions made, actions taken, and outcomes measured against a stated window.
Conclusion
The single most important shift in the analytics process is moving the finish line from insight to measured outcome. Teams that stop at the chart accumulate reports; teams that carry each analysis through to a shipped action and a measured result build compounding institutional knowledge. Start by auditing your last five analytics requests and asking one question of each: what decision changed? Where the answer is nothing, the gap is almost always a missing decision statement at the start or a missing owner at the handover. This framework is drawn from established methodology and repeated field practice rather than theory, and it is deliberately simple because processes that survive real organisational pressure are the ones people can remember without a manual.